
Physics
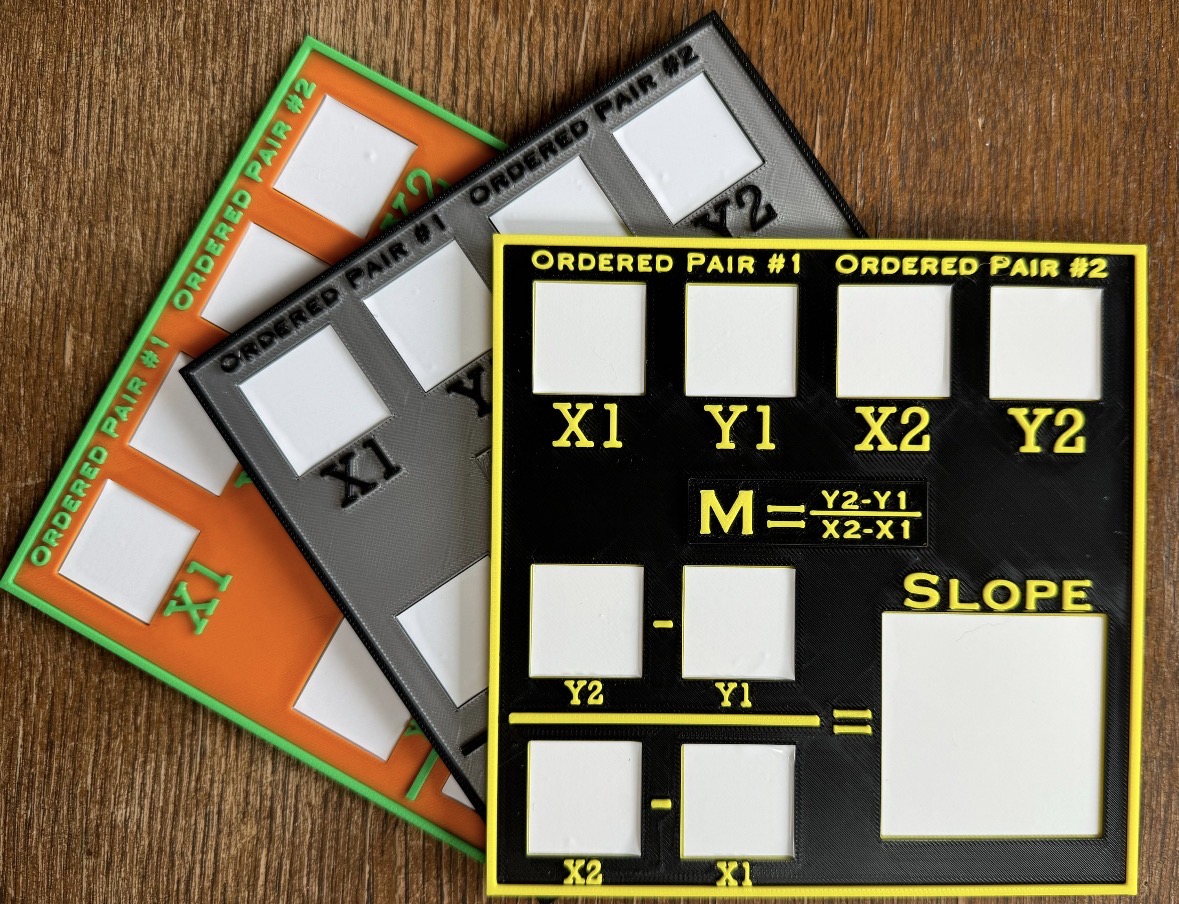
Slope Calculation Manipulative
Direct TEKS: Math 8.4(C) · A.3(A)
Supplemental TEKS: 6.2(C) · 8.2(C) · 7.7(C) · IPC.5(A) · Physics.5(A) · Math 7.4(A) · Math 8.4(A)
Helps students calculate slope using rise over run and interpret slope as a rate of change. Supports mathematics instruction involving linear relationships and science instruction involving speed calculations from distance-time graphs.
Curriculum connections
Direct connections address a component of a standard, not the entire expectation. Supplemental connections support instruction or extend a lesson. Summaries are paraphrased from current official TEA standards.
Middle school
6th Grade Science
Use mathematical calculations to assess quantitative relationships in data.
Use measurements or graph data to practice quantitative calculations; this is scientific-practice support, not a content requirement for the formula.
8th Grade Science
Use mathematical calculations to assess quantitative relationships in data.
Use measured or graphed data for quantitative calculations; this is practice support, not a new average-speed content requirement.
7th Grade Science
Measure, record and interpret motion using distance-time graphs.
Use distance-time graph changes to interpret motion. Slope and speed calculations are supporting methods, not separately named requirements.
7th Grade Mathematics
Represent constant rates of change in mathematical and real-world problems using multiple representations.
Use the two-point calculation board alongside tables, graphs and proportional-context instruction; the tool alone does not supply all required representations.
8th Grade Mathematics
Use similar right triangles to show the slope ratio is constant for any two points on a line.
Pair the formula board with similar-right-triangle instruction; substitution alone does not establish this geometric relationship.
Determine rate of change or slope and y-intercept using table or graph data.
Calculate the slope component using points from tables or graphs. Y-intercept and contextual interpretation require accompanying instruction.
High school
Integrated Physics & Chemistry
Investigate, analyze and model position, velocity, acceleration and time using tables, graphs and mathematics.
Use calculations alongside motion graphs and investigations; the tool supports a portion of the full expectation.
Physics
Analyze motion through position-time, velocity-time and acceleration-time representations using hand graphing and technology.
Calculate and interpret slope alongside motion graphs; all graph types and technology need accompanying instruction.
Algebra I
Determine slope using tables, graphs, two points and equations in various forms.
Calculate the two-point slope component. Tables, graphs and equation forms require additional instruction.